

You can find on this page the USA population map to print and to download in PDF. The USA population density map presents the number of inhabitants in relation to the country size and the structure of the population of USA in Americas.

The USA population density map shows the number of inhabitants in relation to USA size. This demographic map of USA will allow you to know demography and structure of the population of USA in Americas. The USA density map is downloadable in PDF, printable and free.
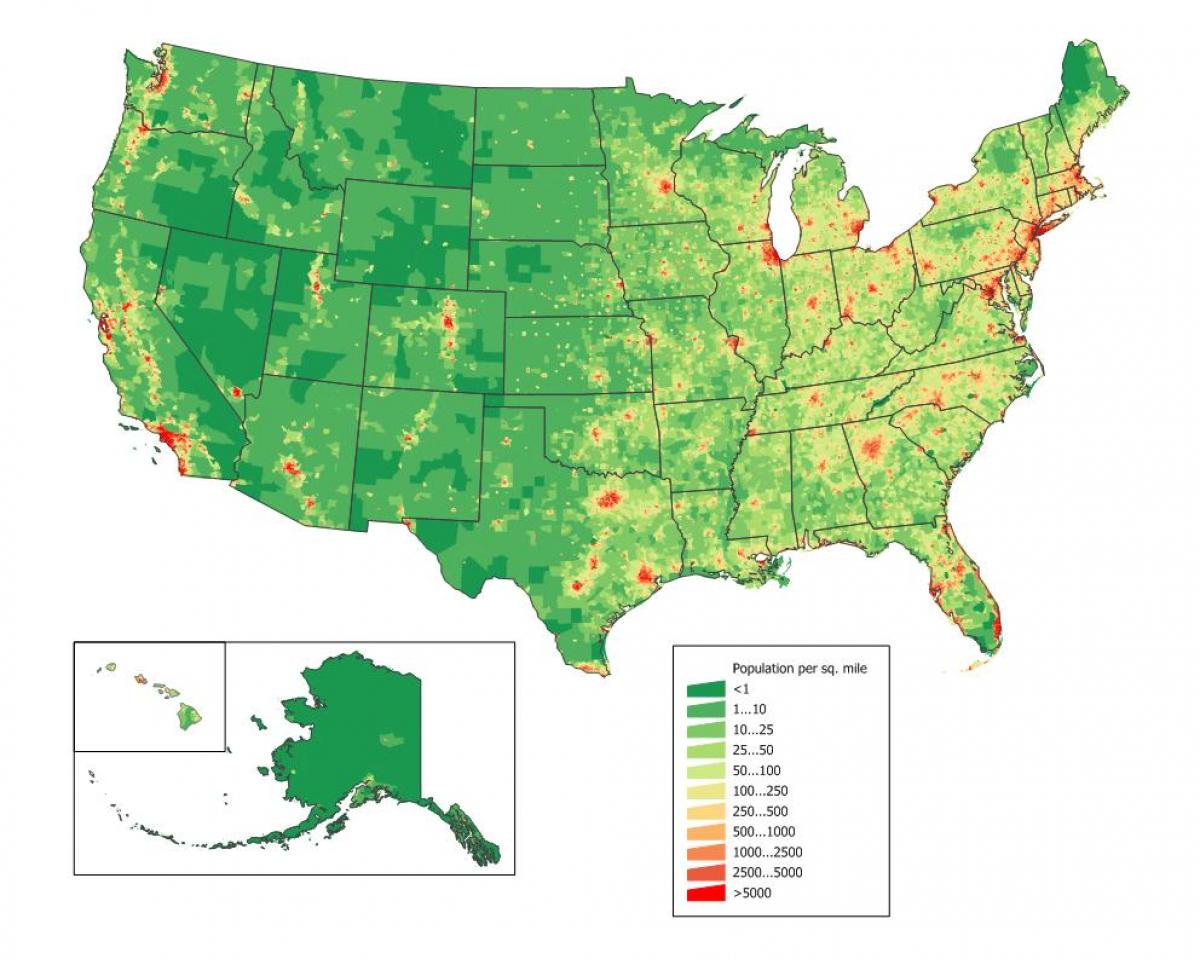
The USA ranks number 3 in the list of countries (and dependencies) by population. The population density in the USA is 36 per Km2 (94 people per mi2) as its mentioned in USA population density map. The total land area is 9,147,420 Km2 (3,531,837 sq. miles). 82.8 % of the population is urban (273,975,139 people in 2020). The median age in the USA is 38.3 years.
The USA is well known the world over for having a diverse population. In 2019, the number of Black or African American individuals was estimated to be 44 million, which represented an increase of nearly four million since the 2010 census as you can see in USA population density map. The number of Asian residents has also increased at a similar rate during the same time period. The Hispanic population in the USA continues to grow, and approximately 18.5 percent of the total population identified themselves in this ethnic group in 2019.
USA population density growth is among the highest in industrialized countries, since the vast majority of these have below-replacement fertility rates and the USA has higher levels of immigration as its shown in USA population density map. The USA Census Bureau shows population increase of 0.91% for the twelve month period ending in July 2011. Nonetheless, though high by industrialized country standards, this is below the world average annual rate of 1.092%.